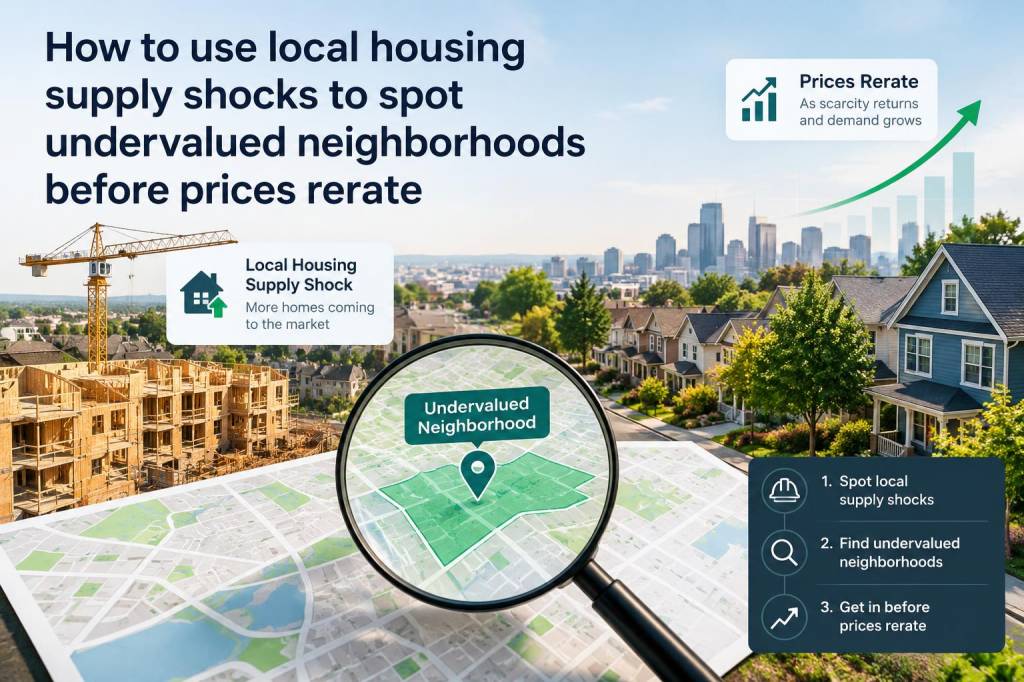
I track dozens of local markets each year, not because I enjoy scrolling listings, but because the places that re-rate fastest are almost always those where housing supply shifted before the narrative caught up. A supply shock — whether it’s a sudden halt to new construction, a municipal zoning change, or a landlord exodus that trims rental stock — can create a window where prices rise faster than the broader market. Below I share a practical, repeatable approach I use to spot those windows early and evaluate whether a neighborhood is truly undervalued or just an anomaly.
What I mean by “local housing supply shock”
A supply shock is any event that materially changes the local stock of housing (for-sale or rental) relative to demand. Examples I watch closely:
- Construction stops: financing pulls out, materials shortages, labor strikes, or new regulatory barriers that delay or cancel developments.
- Policy and zoning changes: new historic overlays, downzoning, or moratoria on permits that effectively cap future supply.
- Large-scale conversions: office-to-residential projects that can flood a market months later, or conversely office-to-industrial conversions that remove potential future housing supply.
- Employer moves: a major employer leaving reduces future housing demand; a large employer arriving increases demand without immediate supply response.
- Natural shocks and disasters: floods, fires, or storms that temporarily remove units and can spur rebuilding under stricter, slower rules.
- Regulatory or financing shocks: lender pullback in a region, local rent-control expansion, or tax incentive removal that changes developer economics.
Why supply shocks matter for spotting undervalued neighborhoods
Markets are forward-looking, but they don’t always price in constraints quickly. If demand is stable or rising and supply unexpectedly tightens, rents and prices can re-rate faster than expected because alternatives are limited. Conversely, an impending wave of supply can depress prices even if fundamentals (jobs, amenities) are solid.
My edge comes from combining local permit and inventory signals with on-the-ground sources — planning commission minutes, builders’ newsletters, and listings data — to anticipate which neighborhoods will see the greatest mismatch between future demand and supply.
A practical framework I use (step-by-step)
Use this as a checklist you can apply to a target neighborhood in under a day, and revisit quarterly.
- Define the micro-market: pick census tracts or five- to ten-block radii — not whole cities. Supply shocks are local.
- Gather baseline data: current inventory (active listings), days on market, median sale price, rent levels, vacancy rate, and building permit counts for the past 4 quarters.
- Scan for recent shocks: read local planning commission minutes, zoning board decisions, and building-permit withdrawals. Pay attention to moratoria or appeals.
- Track developer signals: look for pre-leasing announcements, construction financing pullbacks, or contractor shortages mentioned in local trade press.
- Overlay demand trends: job announcements, transit openings, school boundary changes, and migration flows (e.g., USPS change-of-address data or local school enrollments).
- Quantify the gap: estimate the % change in effective supply over 12–24 months and compare to projected demand growth. If supply falls while demand grows, you have a valid supply shock.
- Model risk/reward: run a simple sensitivity: what happens to rents and prices if vacancy drops by 1–3 percentage points? If upside beats downside in your return horizon, prioritize the market.
Data sources I rely on (and how I use them)
Good analysis is only as useful as your data. Here are the practical sources I check, and what they reveal:
- Local building permit databases: trend in permits issued vs. permits completed — a falling completion rate with steady permit issuance can indicate future supply; permit cancellations or withdrawals are red flags for contraction.
- MLS / Zillow / Redfin: active inventory and days-on-market trends reveal current tightness; I also monitor price per square foot acceleration.
- Census Building Permits Survey & American Community Survey: for cross-checking permit volume and population trends.
- Zoning maps and planning minutes: near-real-time insight into regulatory changes that can be missed by national feeds.
- Street-level checks and satellite imagery: useful for verifying construction status — stalled foundations, fenced-off sites, and for-sale signage.
- Commercial datasets: CoStar, CoreLogic, and local realtor associations for depth if you have access — I use them when available to validate hypotheses.
How I estimate whether a neighborhood is undervalued
“Undervalued” is relative — relative to peer neighborhoods with similar fundamentals, or to the broader metro. I use a two-track approach:
- Relative valuation: compare price-to-rent ratios, cap rates (if income-producing), and price per square foot to nearby neighborhoods within walking distance to the same transit, schools, and employment hubs.
- Forward-looking adjustment: factor in the modeled supply shock. If you expect a 5% drop in effective supply over 12 months and demand steady, that could justify a multiple re-rating vs peers — make this explicit in your valuation.
Simple table: quick checklist to score a supply-shock opportunity
| Signal | Why it matters | Score (0–3) |
|---|---|---|
| Permits withdrawn/stalled | Indicates near-term loss of completions | |
| Falling active inventory | Immediate price pressure | |
| New moratorium/regulation | Caps future supply | |
| Employer arrival/expansion | Boosts demand | |
| Construction financing pullback | Delays projects | |
| Price-to-rent spread vs peers | Shows valuation gap |
Score each 0–3 (0 = no evidence, 3 = strong evidence). A combined score above ~10 typically warrants deeper underwriting.
Examples of traps and how I avoid them
Not every supply shock means opportunity. I’ve seen too many investors buy into “temporary tightness” that coincides with structural demand decline. Here are common traps:
- Fake scarcity: a street with low inventory because sellers are holding for sentimental reasons — supply isn’t constrained, it’s inactive. Check permit and completion data to differentiate.
- Short-term vacancy spikes: caused by seasonal tenants leaving or major renovation waves — transient, not structural.
- Policy that reduces quality: a zoning change that limits new units but also deters investment in amenities can cap upside.
- Over-build pipelines elsewhere: new supply in adjacent submarkets with similar price points can blunt a re-rate.
How I size investments and manage risk
I treat supply-shock plays like an option: limited capital deployed where the asymmetry is strongest and with clear exit rules. Practical sizing rules I follow:
- Limit single-neighborhood exposure to a small percentage of your portfolio (typically 2–5%).
- Prefer assets with multiple exit paths — owner-occupier appeal, strong rent yield, or easy conversion to short-term rental if regulations allow.
- Set time-based milestones: if inventory and rent don’t move within 12–18 months, re-evaluate.
- Hedge with diversification across neighborhoods and property types when feasible.
Finally, I keep an ongoing list of “watch neighborhoods” where early signs appear — a permit cancelation here, a transit announcement there — and revisit them monthly. The combination of disciplined data checks, local intel, and conservative sizing is what’s helped me identify undervalued pockets before broader markets rerate them.