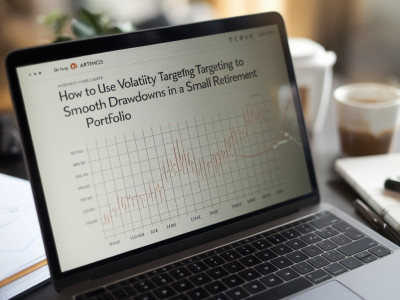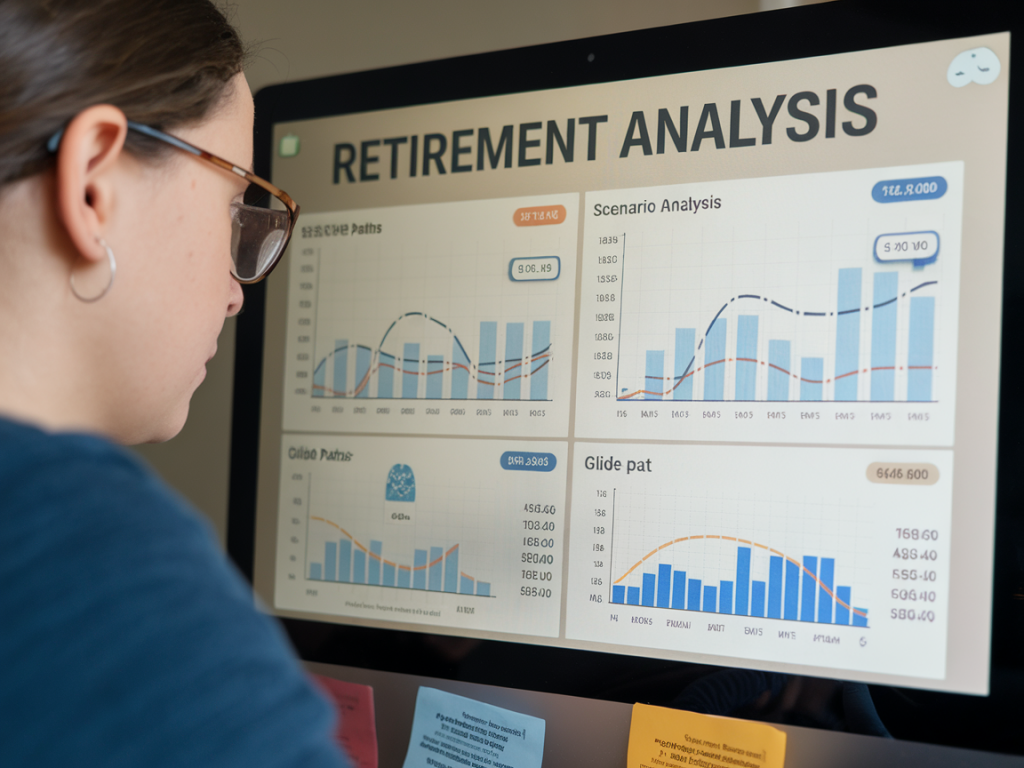
I run scenario analysis on my clients’ retirement plans like a pilot runs checklists before takeoff: it’s not glamorous, but it’s the thing that prevents disaster. When I talk about a portfolio’s “glidepath” toward retirement income, I mean the path your asset allocation, expected returns, volatility, and withdrawals together create as you transition from accumulation to distribution. Scenario analysis doesn’t predict the future. What it does do — and what I care about most — is reveal which assumptions matter most and what actions you can take now to change the odds in your favor.
Why scenario analysis matters for a retirement glidepath
Simple rules like “reduce equities by 10% every decade” sound comforting, but they ignore the realities that determine retirement success: sequence of returns, inflation, interest rates, tax policy, health spending, and behavioral responses. Scenario analysis forces you to make explicit assumptions about those variables and then stress-test your plan across a range of plausible outcomes.
In practice I use scenario analysis to answer questions such as:
How does a prolonged bear market in the early retirement years affect sustainable withdrawals?What happens to my spending power if inflation averages 3.5% vs 2% over the next 15 years?If bond yields stay low, how much of a drag will that be on my safe income alternatives like ladders or TIPS?At what point should I lock in longevity insurance (annuity) or shift capital into income-generating real estate?Key inputs I always vary
Different software packages and advisors use different labels, but I consistently stress-test these inputs:
Expected return and volatility for equities and bonds: I use historical ranges but anchor scenarios to current valuations (CAPE, yield spreads).Sequence of returns: early-retirement losses are far more damaging than identical losses later on.Inflation: real income matters; a 1% vs 3% inflation path compounds quickly.Withdrawal policy: fixed-percent, dynamic (guardrails), or floor-and-envelope (annuity + risky remainder).Contribution and spending shocks: job loss, pension changes, healthcare shocks.Policy and taxes: changes to Social Security, capital gains, and tax-deferred withdrawals.Methods I use (and why)
I rely on three complementary approaches — deterministic scenarios, Monte Carlo simulations, and stress-case walk-forwards. Each has strengths.
Deterministic scenarios: I construct optimistic, base, and pessimistic paths using explicit return sequences and inflation. This makes tradeoffs transparent — you can see exactly which years hurt the plan.Monte Carlo: Useful for estimating probabilities across a wide range of random paths. I prefer Monte Carlo runs that allow for serial correlation and fat tails rather than naive normal-return assumptions. Tools like Portfolio Visualizer and open-source libraries (Python’s numpy + pandas) let me implement this.Stress-case walk-forward: I run specific historical analogs — say the 1970s stagflation, the 2000–2002 tech bear then 2008 crash, and the 2020 pandemic shock — and apply them to current portfolios to see how a repeat would fare. History doesn’t repeat perfectly, but it teaches patterns.A simple example: three glidepath scenarios
Below is a compact table I use with clients to illustrate outcomes under three paths. The assumptions are illustrative, not prescriptive.
| Scenario | Equity Allocation (start) | Average Real Return | Withdrawal Rule | 30-year Success Rate |
| Optimistic | 70% | 5.0% | 4% fixed | 85% |
| Base | 60% | 3.5% | 4% with 1% guardrail | 66% |
| Pessimistic (sequence risk) | 50% | 1.5% | 4% fixed | 38% |
That table is intentionally stark. What it shows is that the combination of lower returns and bad early sequencing can halve your probability of lasting 30 years even with the same headline withdrawal rate.
What scenario analysis typically reveals — and what to do about it
Here are the common lessons I draw from the exercises I run:
Sequence risk is the single biggest operational threat during the conversion period (first 5–10 years of retirement). If your portfolio drops 30% in year 1 while you withdraw regular income, your required withdrawal rate as a percent of remaining assets rises sharply. Solutions: temporary spending smoothing (tap emergency cash), partial de-risking before retirement, or using a spending guardrail strategy (reduce withdrawals when portfolio hits a drawdown threshold).Low-yield environments change the math for fixed income. If bond yields are historically low, a traditional 60/40 portfolio produces less income and less downside protection than models based on long-term averages suggest. Consider diversifying to TIPS, short-term corporate ladders, or low-cost dividend ETFs—but price risk and duration remain critical.Longevity insurance reduces variability but costs capital. An annuity can dramatically increase success probability for a given withdrawal rate, but it’s an irreversible choice and often expensive when purchased at low interest rates. My pragmatic approach: annuitize just enough to cover essential expenses (the “floor”) and keep growth assets for discretionary spending.Flexible withdrawals outperform rigid rules when markets are volatile. Dynamic rules — for example, a 4% base with +/- adjustments tied to portfolio performance — reduce ruin risk. They require discipline and sometimes lifestyle flexibility, so I work with clients to define non-negotiable vs discretionary spending.Sequence-protective buckets matter. A short-duration cash or ladder bucket covering 3–7 years of spending smooths withdrawals through market downturns and buys time for markets to recover without forced selling.Practical steps you can run this weekend
If you want to stress-test your own glidepath without hiring software, try this quick exercise:
Gather your current portfolio balances and income sources (pensions, Social Security, rental income).Pick three return paths: optimistic, base, pessimistic (include a sequence where the first 5 years are down 20–35%).Apply a simple withdrawal rule (4% of starting assets adjusted for inflation) and simulate year-by-year portfolio values for 30 years in a spreadsheet.Run one iteration where you shift 10% from equities to bonds before year 0 and another where you create a 5-year cash bucket. Compare final outcomes and number of years until failure (if any).This simple exercise will illuminate how sensitive your plan is to early losses, to inflation, and to initial allocation. From there, you can explore hybrid tactics: partial annuitization, guardrail withdrawal rules, or a bucket strategy.
Tools and resources I use
I mention tools not as endorsements but because they’re practical starting points: Portfolio Visualizer (free Monte Carlo and backtest), FIRECalc (historical simulation), and open-source Python notebooks if you want full control. For annuity quotes and ladder tools, I’ll use provider pages like Fidelity, Vanguard, and insurers’ illustrative calculators to check pricing and guaranteed income options.
Scenario analysis isn’t a one-time exercise. Market regimes and life circumstances change; I revisit glidepaths annually or after major market events. The goal is not to predict perfectly but to ensure your plan is resilient — that it can survive plausible adverse scenarios without forcing you into unpalatable trade-offs. When we see the scenarios laid out, the decisions become much clearer: reduce exposure, build a cash buffer, buy a partial annuity, or accept a lower sustainable withdrawal rate. Those are operational choices, and scenario analysis shows which ones buy you the most resilience per dollar.