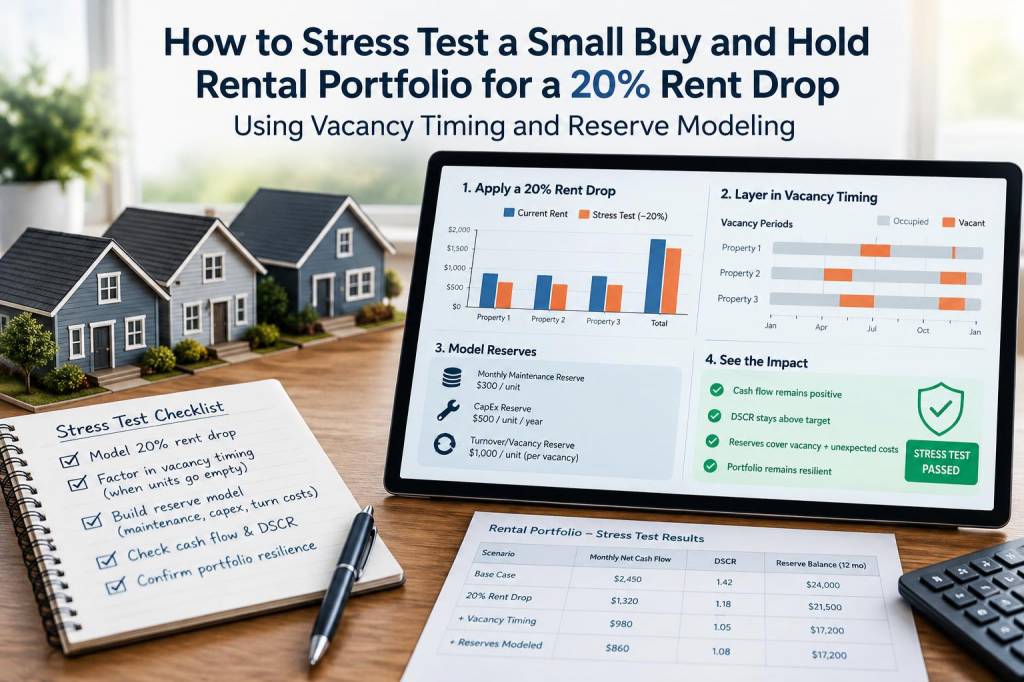
I run stress tests on small buy-and-hold rental portfolios frequently — not because I expect the worst, but because I want to know what “the worst” actually looks like and how much runway I need to get through it. In this article I’ll walk you through a pragmatic, repeatable approach to stress-testing a small rental portfolio for a 20% rent drop using two levers: vacancy timing (how long units stay empty) and reserve modeling (how much cash you hold and when you tap it). I’ll share the spreadsheet logic I use, common pitfalls, and practical rules of thumb so you can apply this to your own holdings.
Why a 20% rent drop is a useful stress case
A 20% rent decline is large but plausible in certain local downturns, rent-control events, or if an employer leaves a market. It’s a meaningful shock that exposes cashflow fragility without being so extreme that every model breaks. It’s also simple to communicate to partners, lenders, or limited partners when justifying reserve targets.
Key variables to model
Before you build anything, identify the variables that most affect cashflow under stress. In my experience, the most important are:
Current rents and expected rent drop: absolute and percentage change.Vacancy timing: average days on market (DOM) and the timing of vacancy spikes across units.Operating expenses: fixed vs variable costs (property taxes, insurance, management fees, utilities, maintenance).Debt service: mortgage payments, interest-only periods, balloon risk, DSCR cushions.Reserves: starting cash, replenishment policy, and acceptable depletion horizon.CapEx needs: scheduled and discretionary capital expenditures.Step-by-step modeling workflow
Below is the workflow I use in Google Sheets or Excel. If you prefer a product, Stessa and Cozy track income but I still build my stress models in a spreadsheet for transparency.
1) Build a baseline monthly cashflow for 12–24 months. Include rent per unit, vacancy allowance, management fees, utilities (owner-paid), maintenance, property taxes (monthly accrual), insurance, and debt service. This gives you a “business as usual” runway.2) Create a 20% rent shock scenario. Apply a 20% reduction to rental income. Decide whether the drop occurs immediately (shock) or phases in (e.g., 10% in month 1, another 10% in month 6).3) Layer vacancy timing. Vacancy timing matters more than just a simple vacancy rate. Model two vacancy dimensions: (a) increased vacancy rate when rents drop (tenants move as prices shift), and (b) longer DOM as lower rents can lengthen re-leasing times. For example, if baseline vacancy is 5% with average 30 DOM, stress to 12% vacancy and 60–90 DOM for the first 6–12 months.4) Model expense behavior. Not all expenses fall with revenue. Management fees may be percentage-based (they fall), but property taxes and insurance generally don’t. For maintenance, expect higher near-term costs as units turn over.5) Track monthly cash balance and reserve drawdowns. Start with your actual cash reserves and deduct monthly negative cashflow. Build rules for when you pull reserves (immediately vs only when monthly deficit exceeds X% of reserves) and when you stop discretionary CapEx.6) Run sensitivity tables. Vary rent drop (10%, 15%, 20%, 25%), vacancy timing (mild, moderate, severe), and reserves to see the combinations that cause failure (e.g., negative cash for >3 months, breach of loan covenants).7) Check covenant and refinance risk. Model DSCR or NOI covenants. A 20% rent drop can reduce NOI enough to breach a lender’s minimum DSCR — that’s a separate operational risk beyond cashflow.A simple sample monthly model (illustrative)
Here’s a compact 3-unit portfolio example I use to teach clients. Replace numbers with your portfolio data.
| Baseline | 20% Rent Drop |
|---|
| Gross rent (monthly) | $6,000 | $4,800 |
| Vacancy allowance (baseline 5%) | -$300 | -$576 (12% vacancy) |
| Effective rent | $5,700 | $4,224 |
| Operating expenses (fixed + variable) | -$2,200 | -$2,200 |
| Debt service | -$2,000 | -$2,000 |
| Net monthly cashflow | $1,500 | -$1,976 |
In this example the portfolio flips from +$1,500/mo to -$1,976/mo — a swing of $3,476. If starting reserves are $30,000, you can cover roughly 15 months at that loss (30,000 / 1,976 ≈ 15). But that doesn’t factor in CapEx, tenant improvements, or lender covenant issues.
Reserve sizing and replenishment strategy
Reserves aren’t one-size-fits-all. My preferred approach is layered reserves:
Operating cushion: 3 months of stabilized operating expenses (utilities, management, debt service).Turnover/CapEx reserve: $500–$2,000 per unit annually depending on age and condition.Stress reserve: Buffer to cover worst-case monthly deficit for a target period (6–18 months) depending on liquidity and access to credit.For many small portfolios I recommend at minimum 6 months of stress reserves (covering negative cashflow after conservative expense cuts), and 12–18 months if your properties are in volatile markets or your loans have tight covenants. If you have an available HELOC or partner liquidity, you can model that as contingent rather than held cash, but be conservative about assuming access during a market-wide stress.
Operational mitigants and policies
Reserves buy time; operations reduce burn rate. Key policies I implement as soon as a stress scenario manifests:
Pause non-essential CapEx and defer cosmetic upgrades.Offer short-term concessions strategically to reduce vacancy days rather than deep permanent rent cuts.Review contracts for scalable costs (switch to percentage-based property management, negotiate vendor pricing).Prioritize high-ROI maintenance to keep units marketable.Open lender conversations early if DSCR or covenant risk appears; many lenders prefer negotiated modifications to surprises.How to present the results to stakeholders
When I report stress-test results I include:
Baseline vs stress monthly cashflow charts over 12–24 months.Reserve depletion curves and the month of “failure” under different scenarios.Covenant breach probabilities and potential remedies (defer CapEx, interest-only switch, equity injection).Action checklist and trigger points (e.g., if cash reserve < X, implement Y).Simple visuals help. A one-page dashboard — starting cash, worst monthly shortfall, months to reserve depletion, and covenant breach month — gives partners something concrete.
Common pitfalls
Most investors make the following mistakes:
Underestimating vacancy timing: using a static vacancy rate instead of modeling DOM by unit inflates resiliency.Assuming all costs fall with revenue: property taxes, insurance, and many fixes don’t drop just because rents do.Counting on refinancing during market stress: credit tightens during downturns — model refinance as a low-probability option.Not stress-testing lender covenants: cash-positive operations can still breach DSCR or NOI covenants.Tools and templates
I build my models in Google Sheets for collaboration. Useful add-ons and tools:
Stessa — for income/expense tracking to populate baseline numbers.Rentometer or Zillow rents — to sanity-check market rents and potential drop magnitude.Google Sheets sensitivity tables and scenario tabs — for quick scenario swaps.If you’d like, I can provide a downloadable sample spreadsheet with the template I described that includes toggles for rent drop severity, vacancy timing, and reserve levels so you can plug in your portfolio numbers and see the outcomes immediately.